
This post was created while writing my Up & Running with Polars course. Check it out here with a free preview of the first chapters
You can’t optimise your code if you don’t know where the bottleneck is.
DataPolars now has a profiling tool to show you what it’s getting up to.
You can get this data by calling .profile on any lazy query. Even better, we can get a plot visualising the time spent on each step.
In this example we read from a CSV file, do a groupby and then a sort.
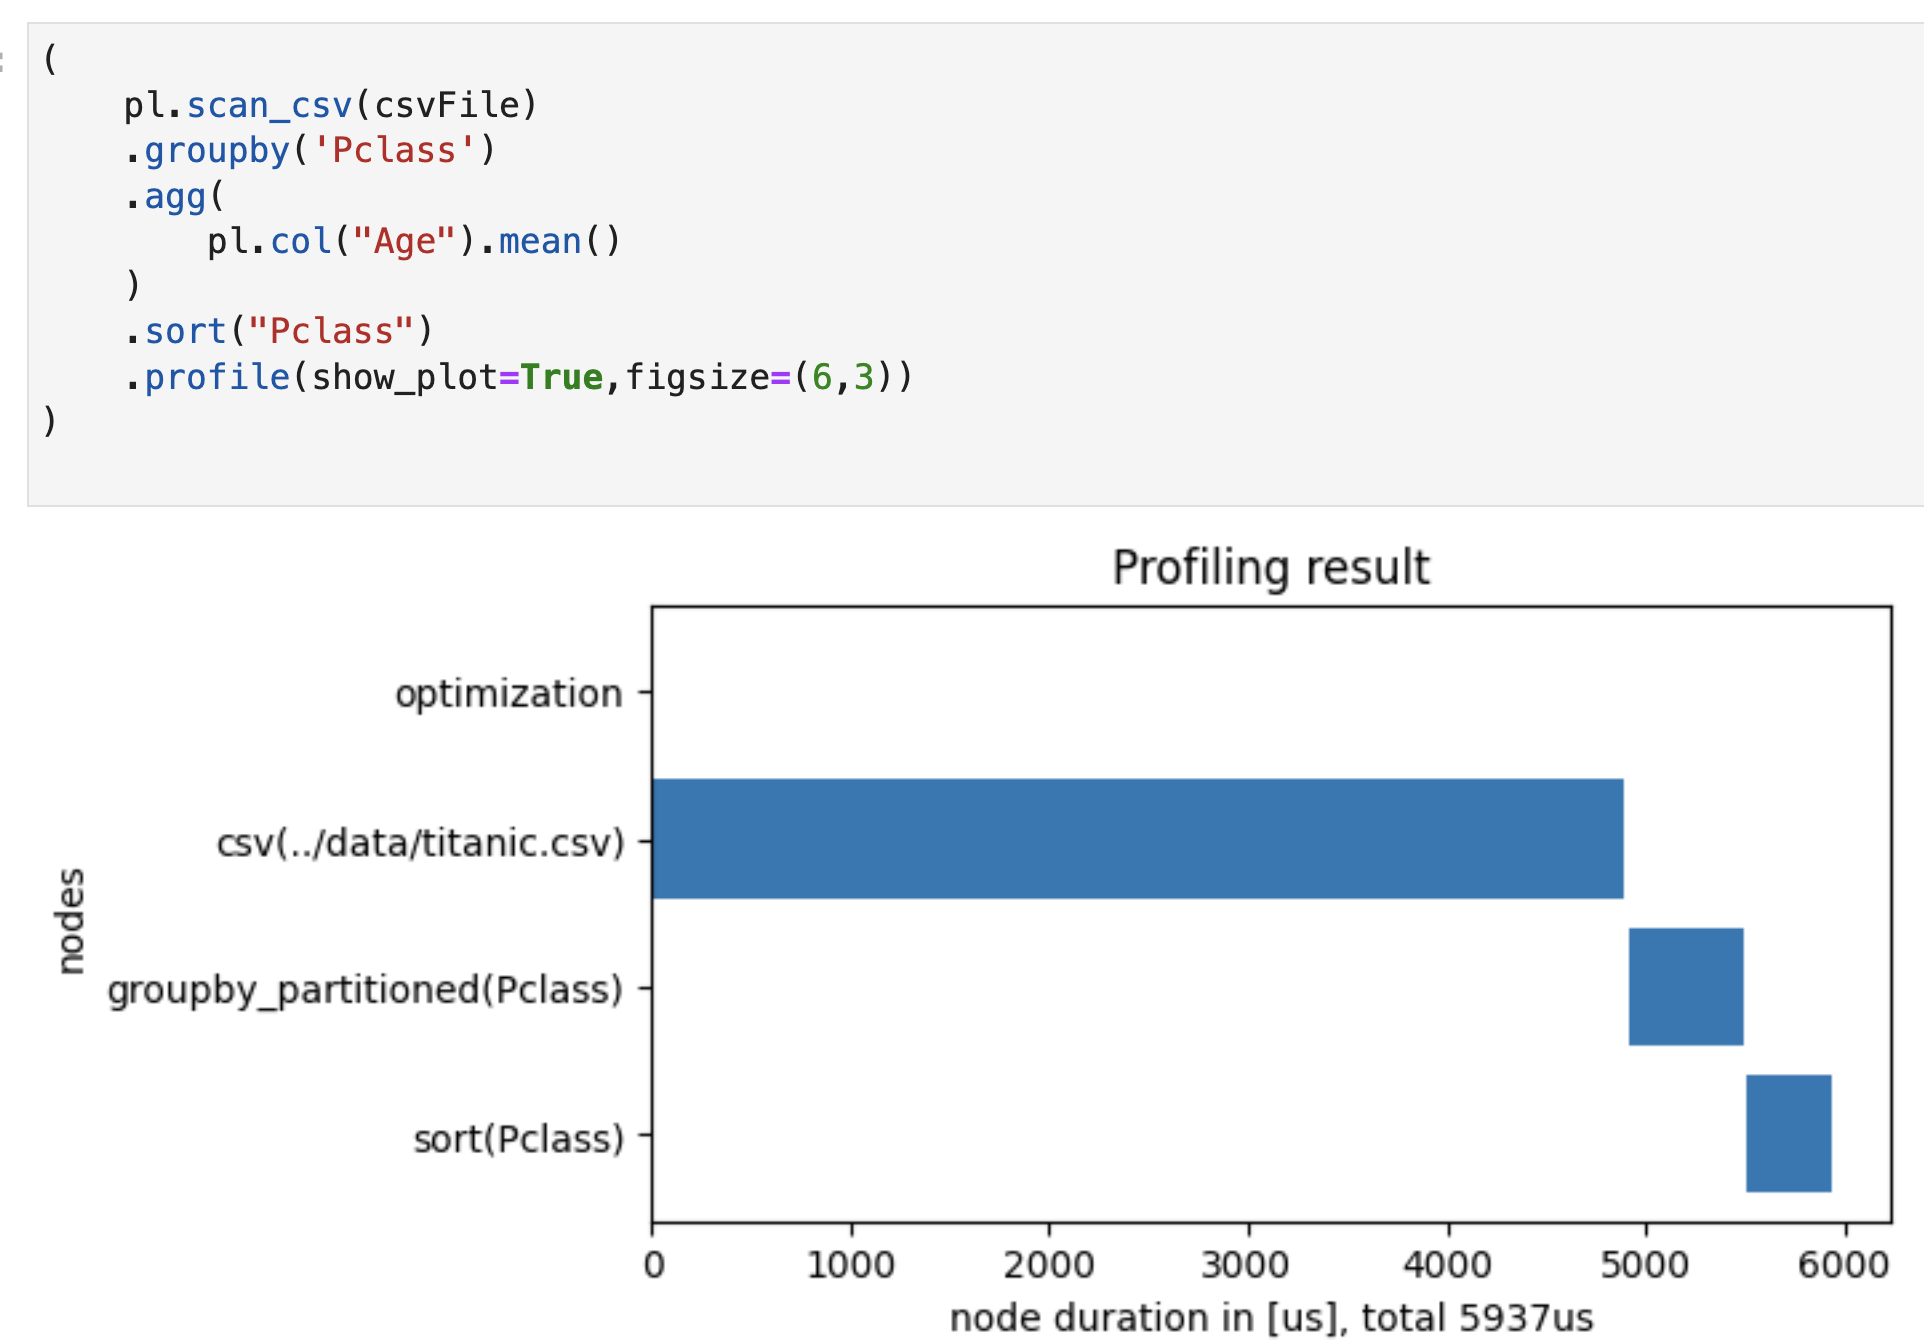
In the chart we see that reading the CSV file is the bottleneck. So we should focus our efforts on that step with strategies like specifying dtypes or - even better - converting to Parquet or Arrow.
Learn more
Want to know more about Polars for high performance data science and ML? Then you can:
- join my Polars course on Udemy
- follow me on bluesky
- follow me on twitter
- connect with me at linkedin
- check out my youtube videos
or let me know if you would like a Polars workshop for your organisation.