
Altair has been my favourite visualisation library for a long time. It allows me to make attractive visualisations with an API that is concise and consistent. The good news is that Altair is now the default plotting backend for Polars and so it’s easy to work with them both together.
In this post we look at how we can use Altair and Polars and how VegaFusion is helping Altair to scale up to larger datasets.
There is much more on visualisation with Polars in my highly-rated Up & Running with Polars course
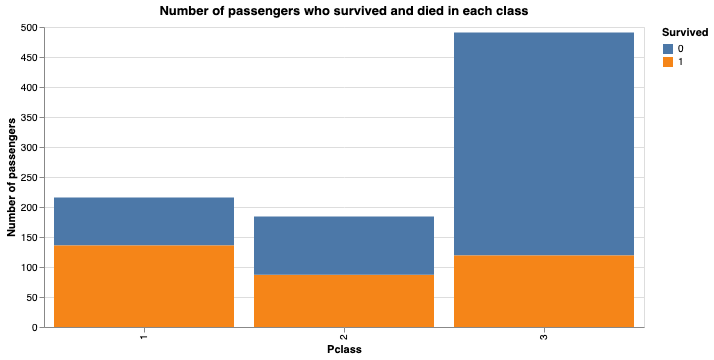
Here’s a chart from my course using the Titanic dataset. We first create it using Altair directly and then see how to do the same thing with Polars.
In the chart we are going to display the number of passengers who survived and died in each class. While we can do aggregation in Altair, I prefer to do aggregation in Polars and then pass the aggregated data to Altair.
1
2
3
4
5
class_survival_counts = (
    df
    .group_by('Survived','Pclass')
    .len()
)
We then create the chart directly with Altair
1
2
3
4
5
6
7
8
9
alt.Chart(
    class_survival_counts,
    title="Number of passengers who survived and died in each class",
    width=600
).mark_bar().encode(
    x="Pclass:N",
    y=alt.Y("len:Q",title="Number of passengers"),
    color="Survived:N"
)
 If you aren’t familiar with Altair I’ll explain what’s going on:
- The
alt.Chartfunction takes a Polars DataFrame as an argument and creates a chart object - The
mark_barmethod specifies that we want some kind of bar chart - The
encodemethod specifies how the data should be displayed on each axis. In this case we are encoding thePclasscolumn on the x-axis, thelencolumn on the y-axis and theSurvivedcolumn as the colour of the bars. - For the
yargument in encode we passedalt.Y. This is what Altair calls a channel encoding and species the format for data on an axis.
In the encode block we use Altair syntax by adding :N to the column name to specify that it is a nominal variable and :Q to specify that it is a quantitative variable. If we don’t do this then Altair interprets the integer values in the Pclass column as quantitative and place narrow bars at 1.0, 2.0, 3.0 instead of wide side-by-side bars at 1, 2, 3.
Now let’s see how we can do the same thing from Polars
1
2
3
4
5
6
7
8
9
class_survival_counts.plot.bar(
    x='Pclass:N',
    y=alt.Y('len:Q',title='Number of passengers'),
    color='Survived:N',

).properties(
    width=600,
    title="Number of passengers who survived and died in each class"
)
The code inside the plot.bar method is very similar to the Altair code in the encode block. For finer control over the plot there are two key things to understand about this approach.
Firstly, the arguments to e.g. x and y are not restricted to just be string column names but can accept Altair channel encoding objects (like alt.Y above). Indeed, if we just pass a column name string then Polars converts it to an Altair channel encoding for that axis internally. These channel encodings allows us to control many aspects of an axis such as the axis title, sort order, number formatting etc.
Secondly, the output of df.plot.bar is a standard Altair Chart object. This means that we can use all the standard Altair methods like properties to control the appearance of the chart or we can pass multiple charts to an Altair hconcat or vconcat method to create a multi-panel chart.
One other important point about Altair and Polars: when you create a chart from a DataFrame with many columns then the data from all columns is passed to the browser - not just the data from the columns that you are using for the chart. This can overload your browser. To avoid this you can use the select method to select only the columns you need for the chart.
1
2
3
4
5
6
7
8
9
class_survival_counts.select("Pclass","Survived","len").plot.bar(
    x='Pclass:N',
    y=alt.Y('len:Q',title='Number of passengers'),
    color='Survived:N',

).properties(
    width=600,
    title="Number of passengers who survived and died in each class"
)
Vegafusion
The other interesting development around Altair is Vegafusion. Vegafusion can help Altair charts to overcome the infamous MaxRowsError (where Altair refuses to make charts with more than 5,000 rows of source data). Vegafusion does this with serverside rendering.
What is serverside rendering?
In a classic Altair chart you give Altair your rows of data and Altair (via the Vega-lite library) passes this data to your browser which uses Vega-lite turn the data into html objects that can be rendered. However, with this approach (called clientside) your browser has to deal with more and more data as the number of rows grows.
With Vegafusion the rendering happens serverside. This means that you create your Altair chart as normal, but then the data is passed to the Vegafusion engine which is happier processing large datasets than your browser. The Vegafusion engine then passes the smaller rendered html to your browser.
To use Vegafusion you import it and run vf.enable which tells Altair that Vegafusion will handle rendering.
1
2
3
import altair as alt
import vegafusion as vf
alt.data_transformers.enable("vegafusion")
Once you’ve done this import then you can use Altair via Polars as above to create your chart. The rendering will be done by Vegafusion.
Of course your browser may still be unhappy if there are many html objects to render! For example, if you are making a scatter plot with thousands of points this will still be a lot of work for your browser (and may crash it).
For more on visualisation with Polars see these posts:
Want to accelerate your analysis with Polars? Join over 3,000 learners on my highly-rated Up & Running with Polars course
Next steps
Want to know more about Polars for high performance data science? Then you can: